Last week, my team made a lot of progress on our blood pressure monitor device!
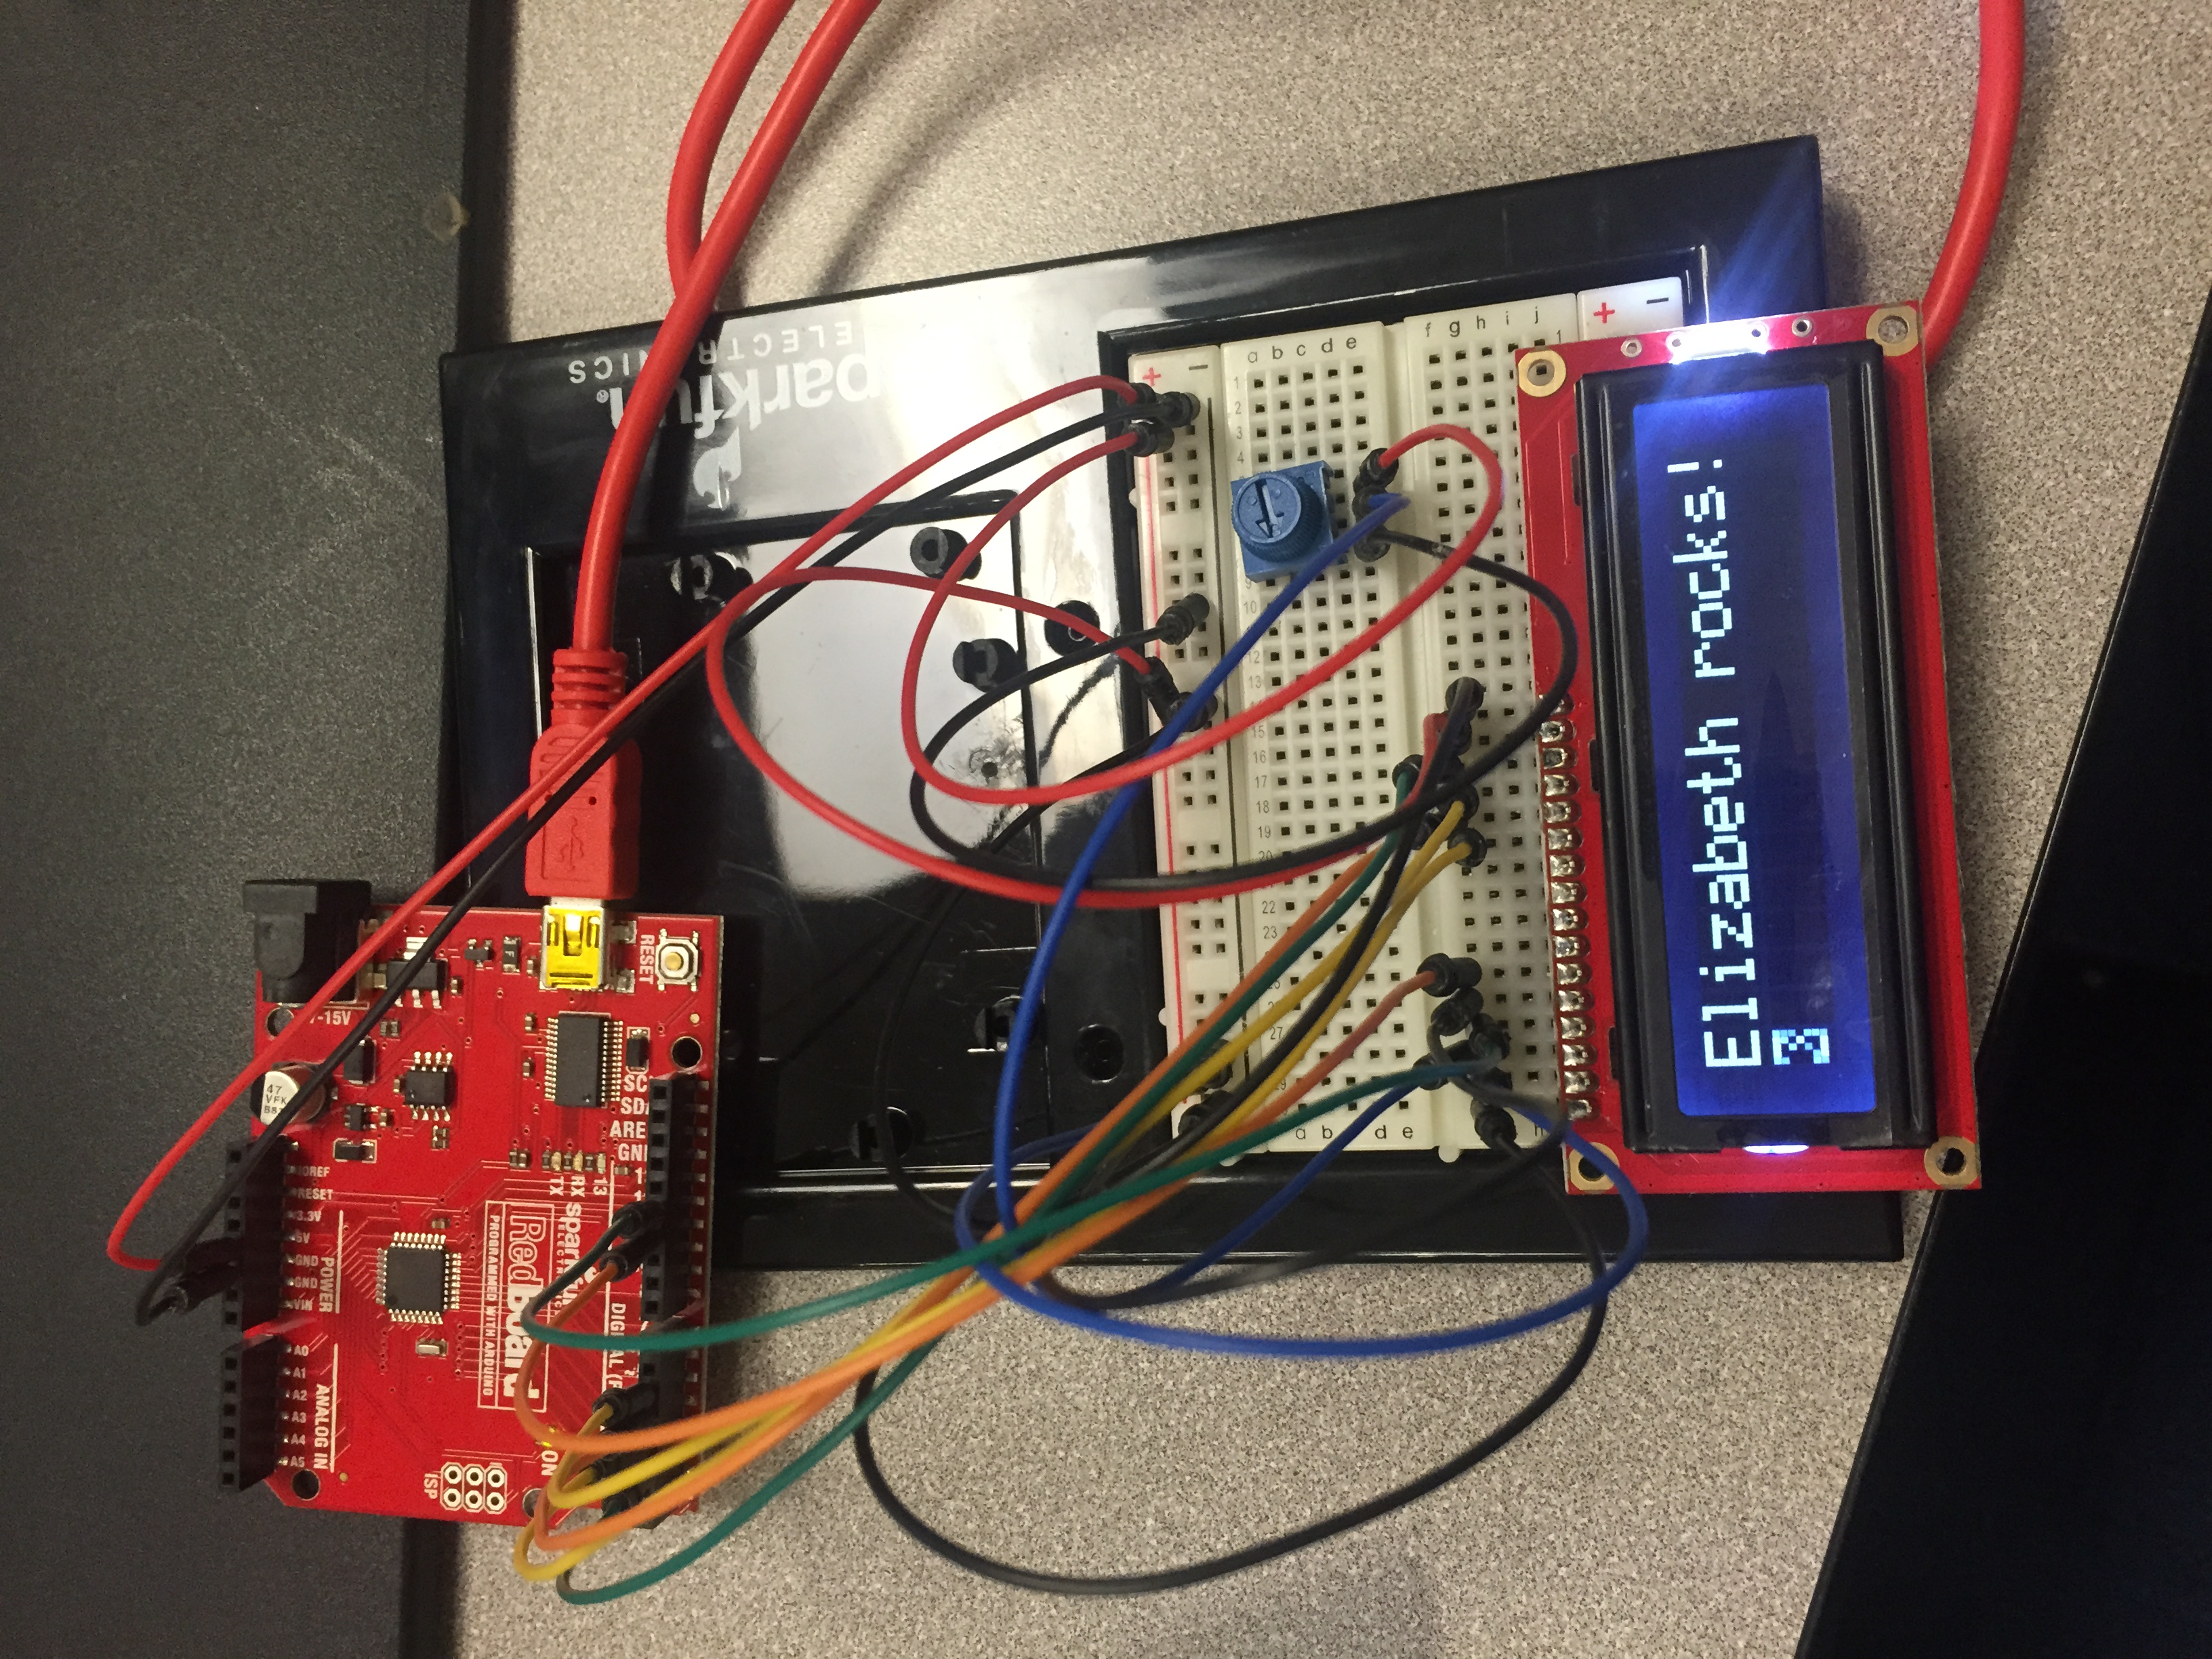
First, we finished up learning arduino background. This is definitely the coolest circuit I made:
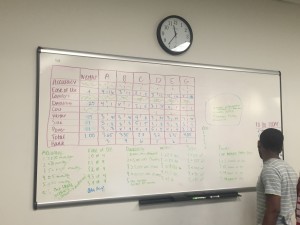
We jumped back into the design process by completing Pugh Screening and Pugh Scoring matrices. This is our final Pugh Scoring matrix, in which we were deciding between six possible designs:
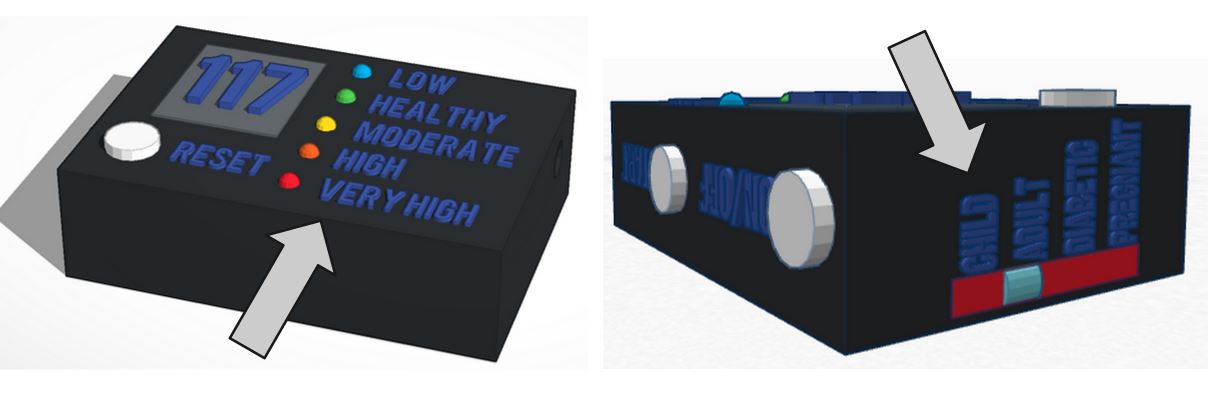
The design that won (labelled “G”) is an arduino based design. Essentially, by using both a pulse sensor and a pressure sensor, the arduino will be able to extract the pressure measurements at appropriate times (the times will be determined by the pulse sensor–at the start and stop of Korotkoff sounds, which are pulse sounds). With this information, the arduino can display the numerical value for the mean arterial pressure and then light up the corresponding LED. The first arrow points to our scale of LEDs, and the second arrow points to the switch that allows the user to specify what kind of patient is being tested. This is important because the cutoffs for healthy blood pressures are vastly different between these groups.
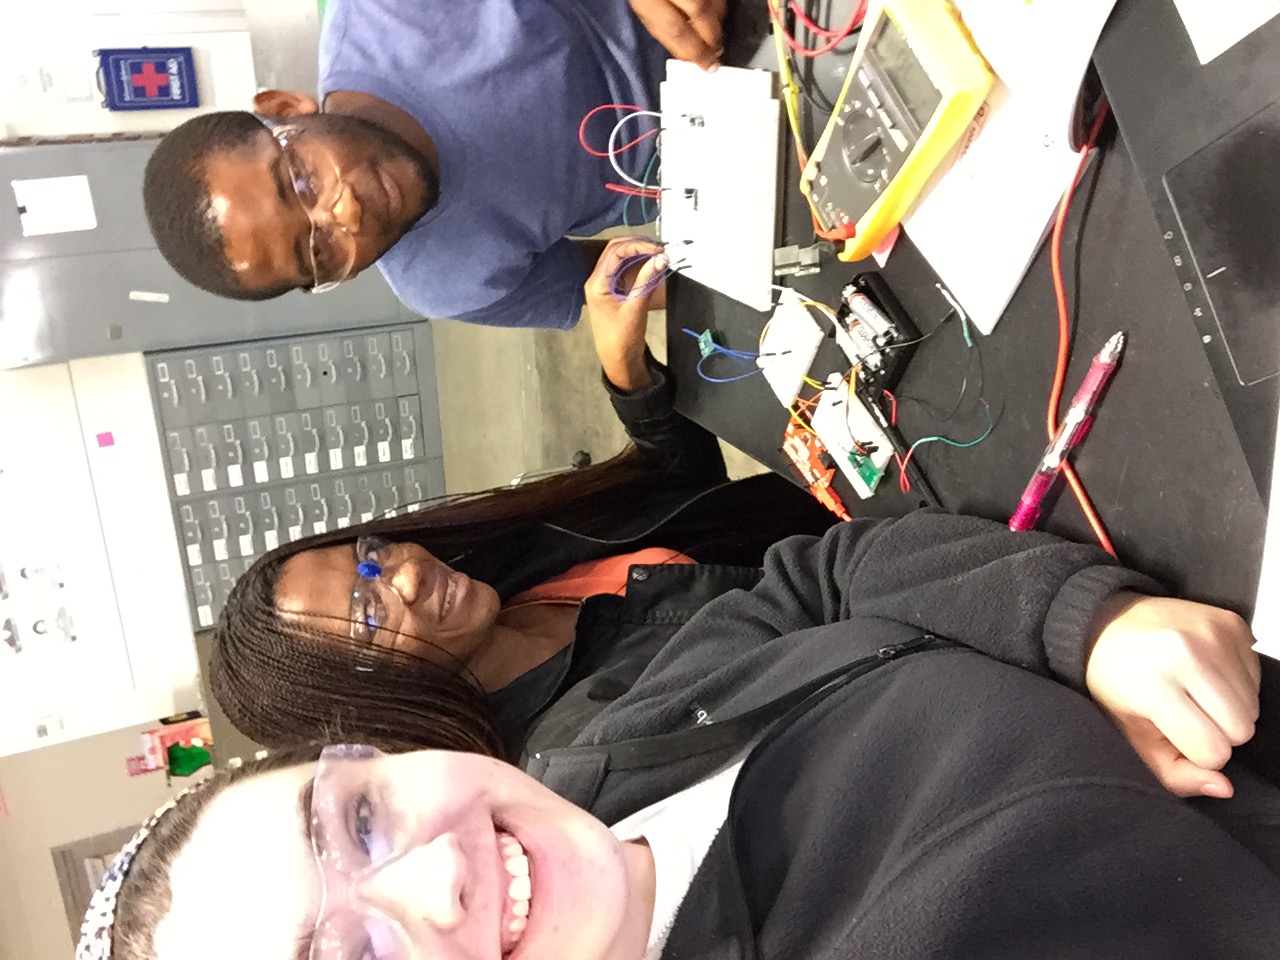
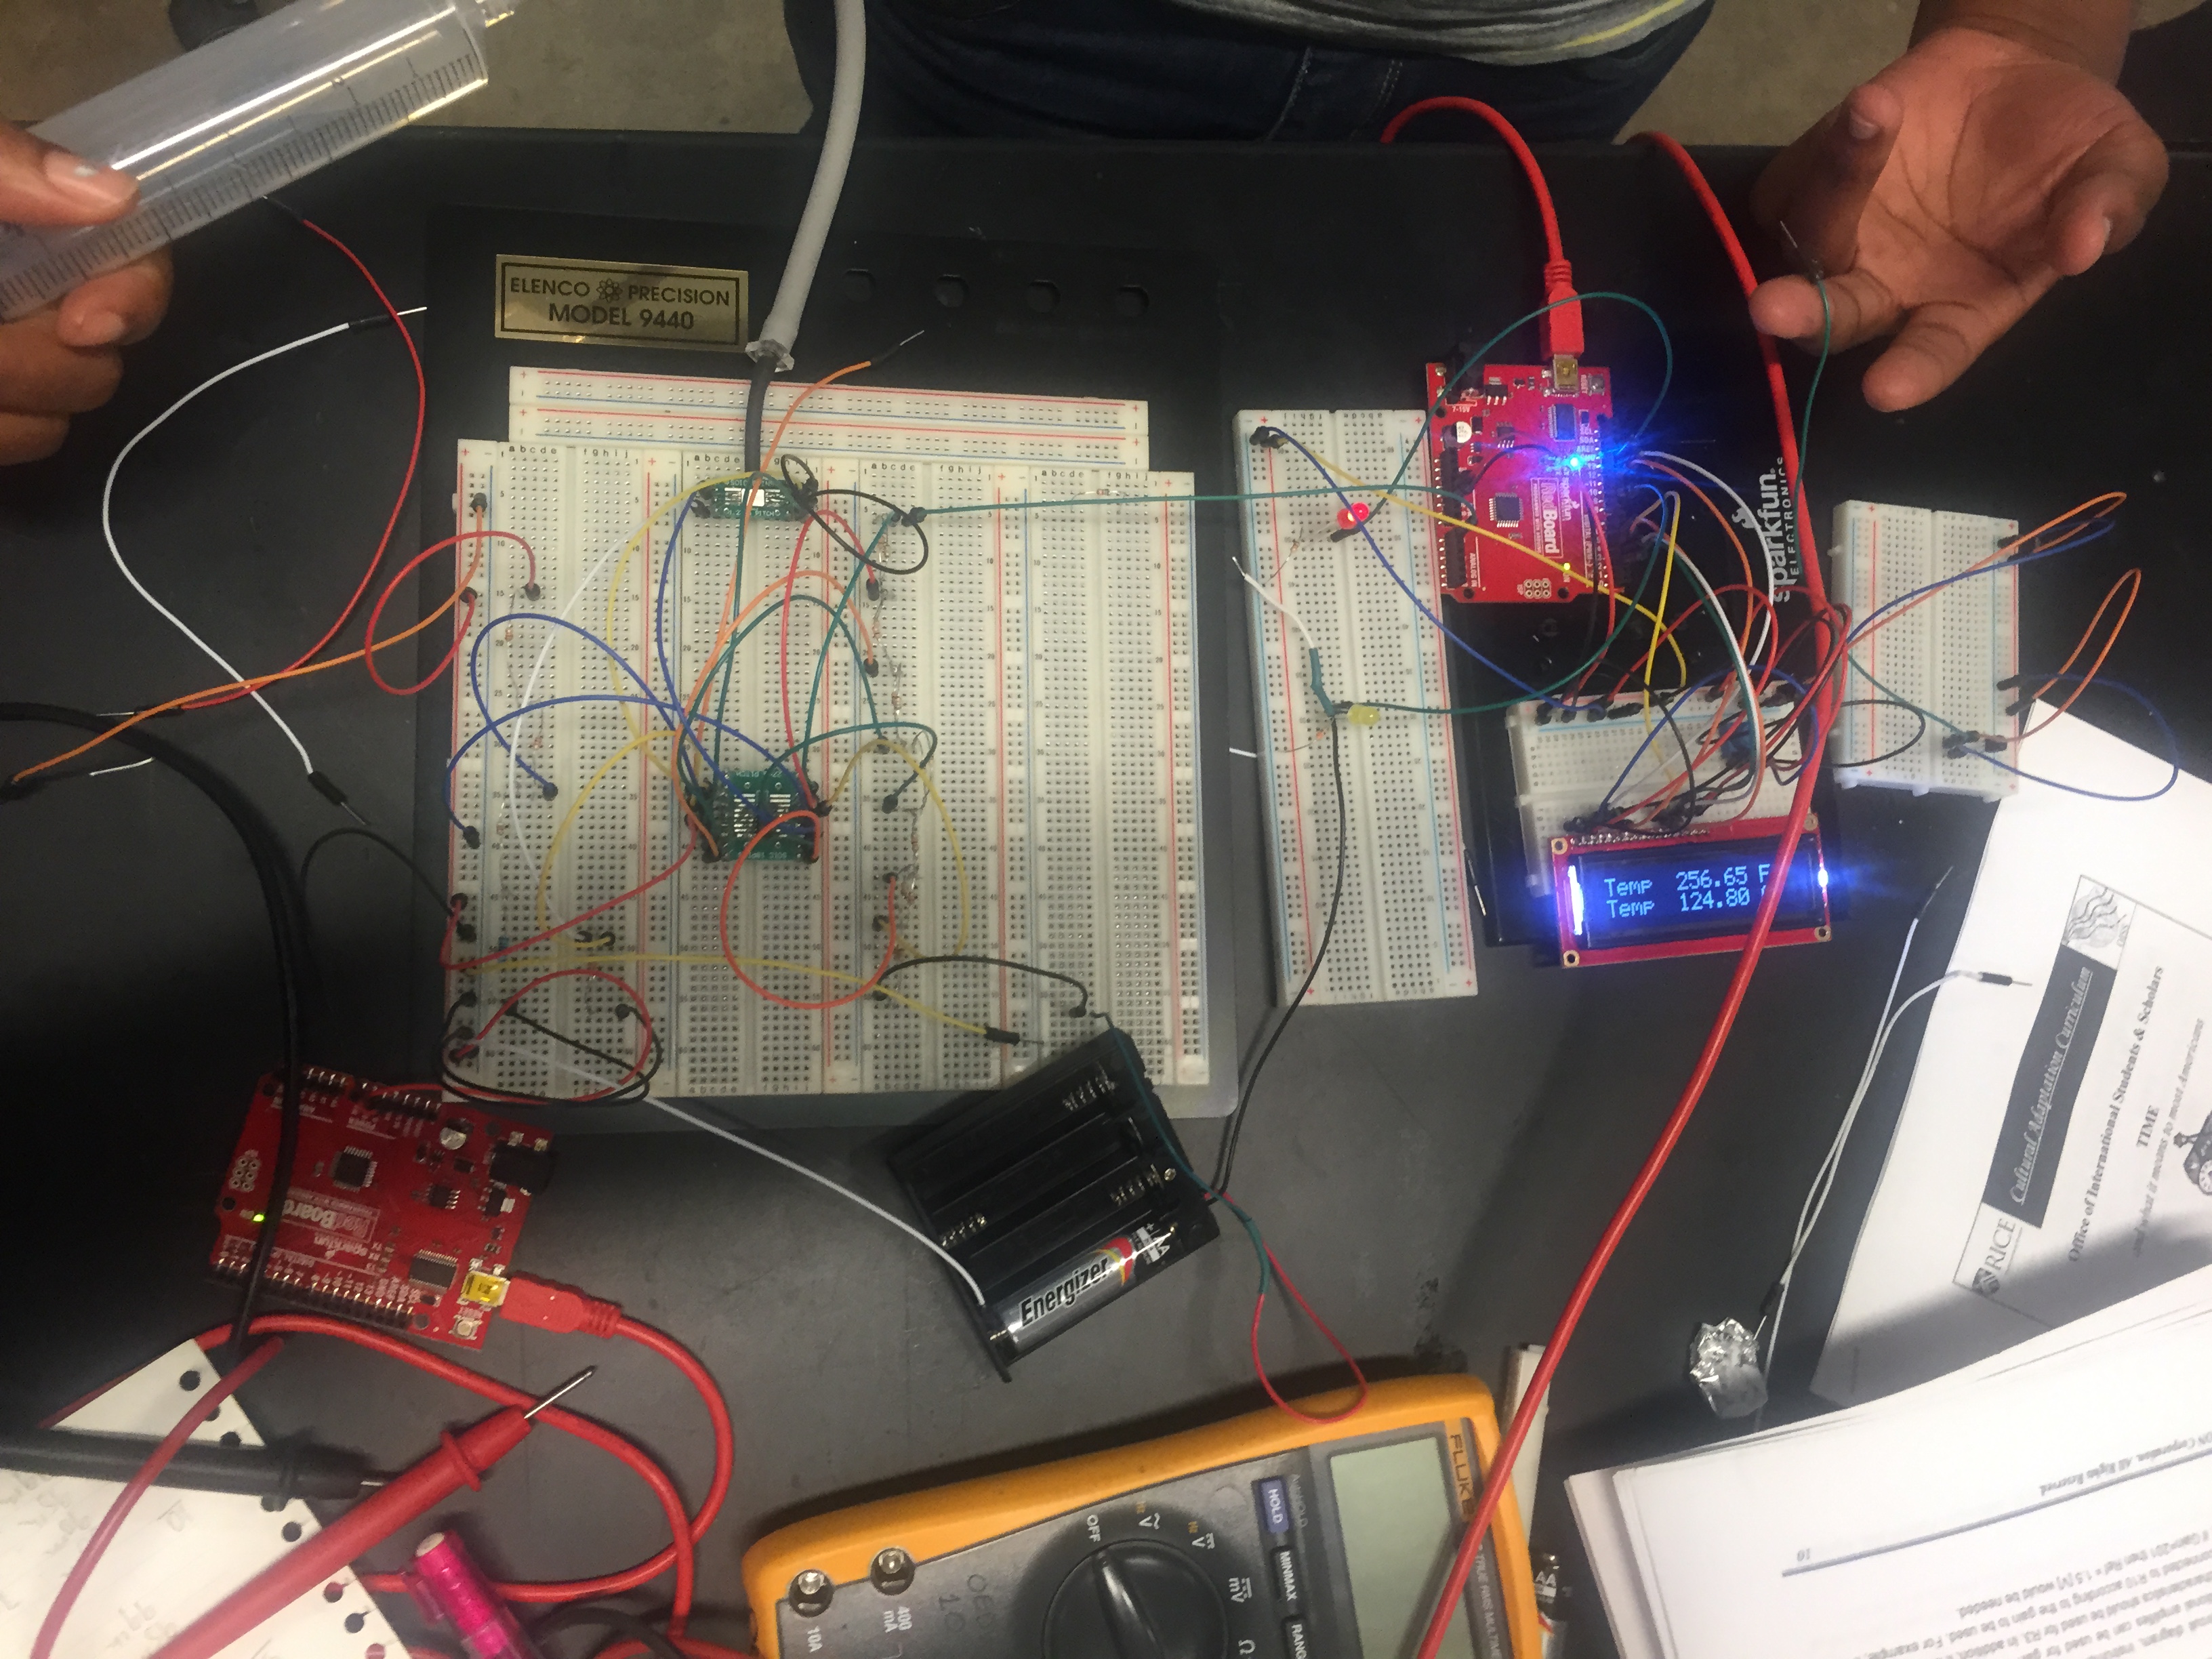
With our design selected, we got right to work! We made a simple circuit using our pressure sensor that senses pressure and converts it to a voltage shown on an LCD (we still need to find the formula to convert that voltage back to pressure). I’m not great at electronics, but I’m learning so much–it’s nice being on a team with two senior electrical engineers! Here we are working:
And our completed circuit:
This week, we’re hoping to find the formula to convert voltage back to pressure and hopefully make a functional prototype. We get Friday off for Independence Day, so it’s a bit of an ambitious goal, but since we’ve been working quickly so far, I think we can do it!